
Below is an interesting article from Climate.gov detailing the outlook and reasoning for the lowering:
The CPC/IRI ENSO forecast has dropped the likelihood of El Niño again, to 58%, despite the presence of “borderline” El Niño conditions (i.e. warmer equatorial Pacific sea surface temperature, and some reduction in rain over Indonesia). El Niño is still expected, but with less confidence. What is it about this year that may be making it harder to forecast?
Many studies, using both long-term climate model simulations and observed data, have found that ENSO changes on decadal (10-year) or longer timescales. This low-frequency or interdecadal variability includes changes in ENSO strength (variance) and frequency (how often events re-occur).
In other words, in one decade, the pattern may be weak El Niño events followed by weak La Niña events every other year, and then the next decade the pattern may be just a handful of strong, irregularly spaced events. These decadal shifts are largely not predictable (Wittenberg et al. 2014; if you’re interested in a lot of technical detail about the interdecadal variability of ENSO, check out the references in that article.)
In an earlier post, I discussed the start times we’ve seen in ENSO events in the past, and mentioned how in the last decade, we’ve seen events starting later in the year than in decades prior. This isn’t the only recent change in the characteristics of ENSO, though, and many scientists think we have seen a shift in low-frequency variability since around the year 2000 (e.g. Yeh et al. 2009, Lee and McPhaden 2010). These shifts may make ENSO prediction harder for today’s state-of-the-art climate models to predict.
One example of the evidence of a change in ENSO behavior is that El Niño events since 2000 have tended toward the central Pacific flavor, and there have been more frequent, less intense events (Lee and McPhaden 2010, Hu et al. 2013). Along with weaker ENSO, we’ve observed changes in the thermocline, the line that separates the warmer upper ocean and the colder deeper waters (often identified by the depth of the 20°C layer).
The thermocline is now deeper in the western Pacific, and shallower in the eastern Pacific (Fig. 1), which means that colder waters are closer to the surface in the eastern Pacific (Wen et al. 2014). Yet another change is that winds near the equator are more easterly, indicating a strengthening of the Pacific Walker circulation (e.g. L’Heureux et al., 2013; Sohn et al., 2013).
 |
| Figure 1: Schematic of average thermocline position and easterly winds, pre-2000 (left) and post-2000 (right). Shading shows average sea surface anomalies during El Niño events in each of the two periods. Figure by climate.gov. |
All of these changes affect the development of ENSO, and one implication of the shift in decadal (or longer) variability is that ENSO may be less predictable while this phase interdecadal variability is underway. For example, much of the predictability of ENSO is based on the slow movement of warm Pacific subsurface ocean waters. In the period prior to 2000, anomalies in the warm water volume would occur six or eight months before the start of an ENSO event. Since 2000, this lead time has shrunk to only two or three months (Fig. 2; McPhaden 2012).
 |
| Figure 2: Warm water volume anomalies in the tropical Pacific (green) and Niño3.4 index (purple). Figure by climate.gov from CPC data. |
In addition, the shift toward weaker, more centrally located El Niños is more difficult for climate models to capture (e.g. Kirtman et al., 2013; Xue et al. 2013). The depth of the thermocline, equatorial winds, and sea surface temperatures are inextricably linked–and so the combination of certain factors results in changes in how well ENSO can be predicted.
An illustration of how weaker events are harder to predict is shown by the four “missed” events in the model prediction of the October-December ENSO index: all were weak events that the models thought would be neutral (three of these four have been since 2000). The “false alarm” forecast of 2012 was for a weaker El Niño (Niño3.4 between +0.5 and +1.0°C) that never occurred. If an El Niño develops this year, it’s likely to be weak.
What is this 58% confidence–still close to 3-in-5 odds–based on, then? Well, surface temperature anomalies are hovering around the +0.5°C threshold, and most of the dynamical models are still calling for increasing Niño3.4 anomalies. As well, another downwelling Kelvin wave has developed (Fig. 3), which will continue to supply the central and eastern Pacific with warmer-than-average sea surface conditions.
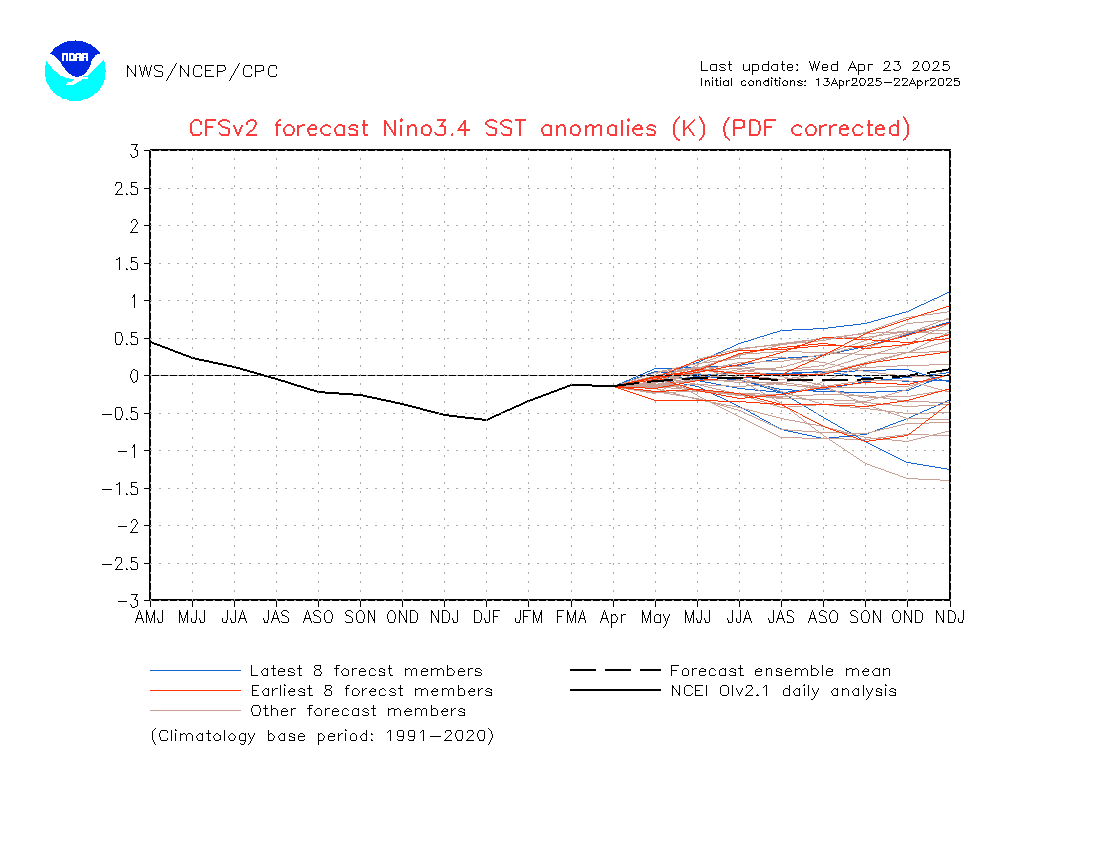
The CFSv2 has an unusual forecast (some slight cooling in the Niño3.4 region, then increasing warm anomalies through the spring) that’s difficult to interpret. We’re still not seeing much of an atmospheric response to the surface warming, so there is now concern that if El Niño conditions are achieved, they won’t persist for the five overlapping seasons required for this to be called an El Niño event. So, we’re still calling for the development of El Niño–just with less confidence.
 |
| Figure 3: Sea surface height anomalies in early November 2014. Red indicates higher-than-average heights caused by warm waters of the current downwelling Kelvin wave. Figure by NASA/JPL. |
No comments:
Post a Comment